Interactive visual tools
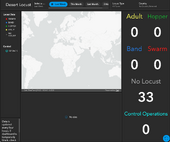
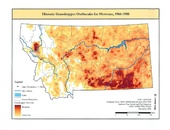
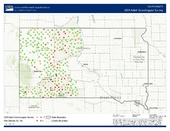
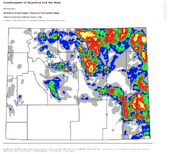
Interactive visual tools in locust and grasshopper management are digital materials that present information in a visual form and let users engage with it directly, such as through clicking, zooming, filtering, or navigating content. They can include geospatial dashboards that track outbreak locations, interactive maps showing pest distribution, historical maps of past outbreaks, presentations summarizing monitoring data and control strategies, promotional material highlighting success stories, infographics explaining species biology or treatment methods, decision support systems for treatment timing and threshold-based actions, and videos documenting field operations or training content.